Turn everyday safety activity into better decisions.
Collecting information is only useful when people can understand what it is telling them. Simple Safety Coach brings operational activity, trends, and actionable items into dashboards and reports that help Safety Managers and leaders see where attention is needed and where progress is being made.
Move beyond collecting data for its own sake.
Incidents, Safety Observations, inspections, training, surveys, participation, and other safety activities create information throughout the organization. Reporting becomes valuable when that information helps leaders recognize patterns, focus resources, ask better questions, and decide what should improve next.
Use dashboards for current visibility and reporting for deeper understanding.
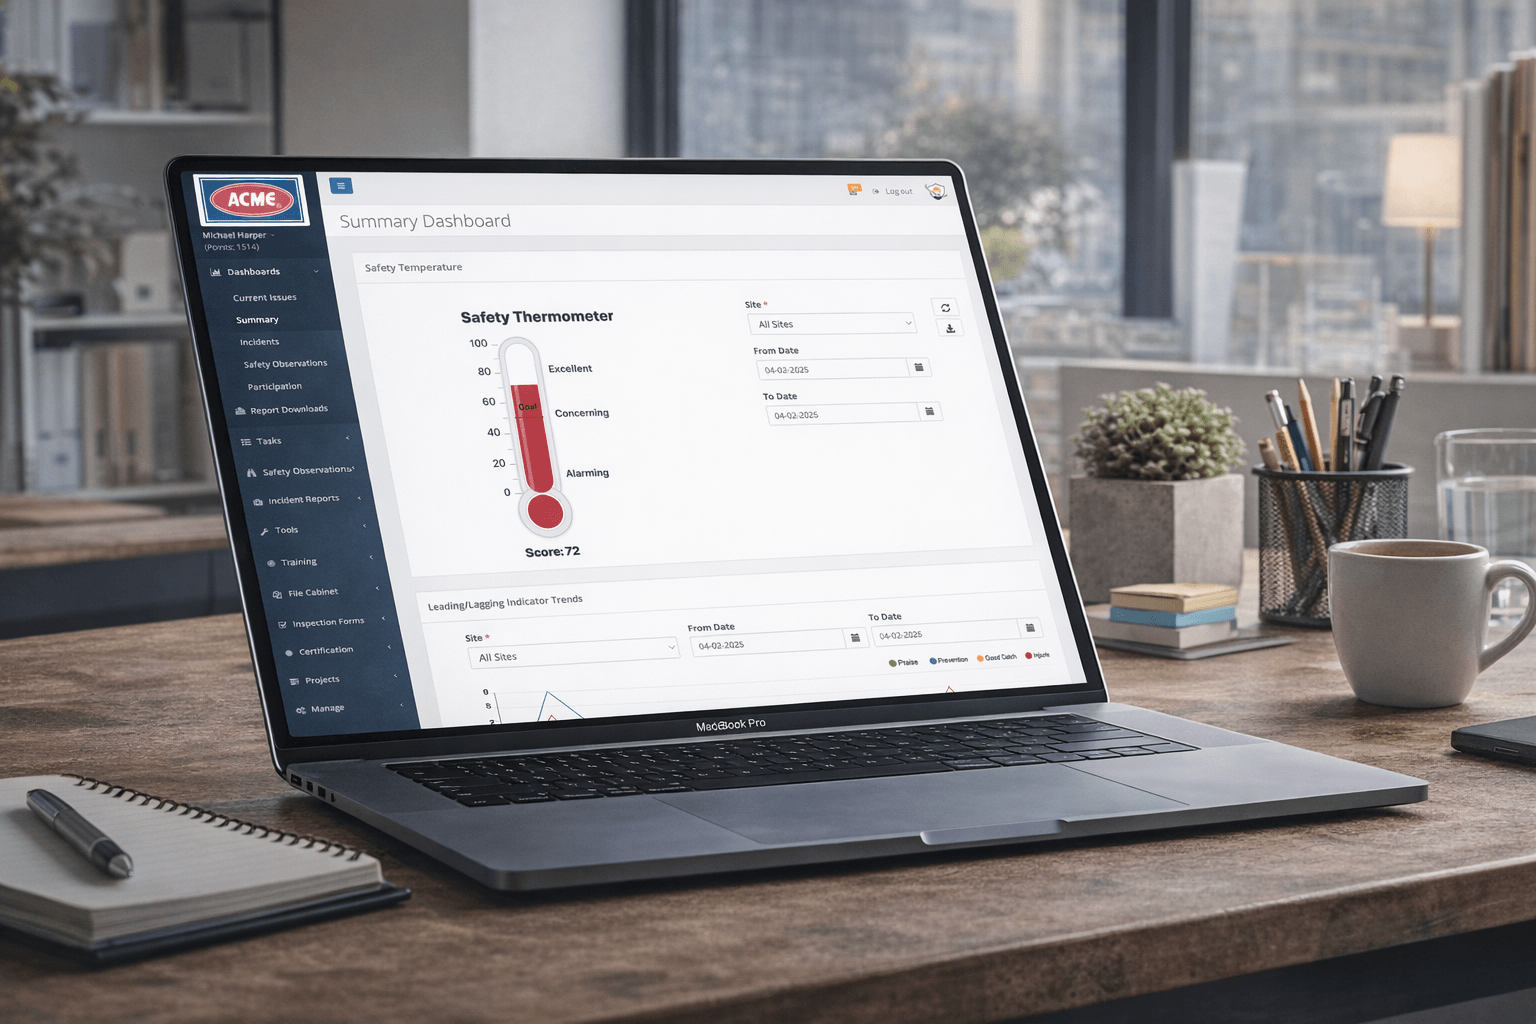
SSC combines an Activity Dashboard for monitoring actionable items with reporting views that help organizations understand safety activity and trends over time.
- Monitor open and actionable safety items from the Activity Dashboard
- Review trends instead of relying only on individual records
- Use visual reporting to support leadership and safety-team conversations
- Download charts and summaries for presentations and follow-up
- Use PDF and Excel reporting where supported by the underlying capability
Look across the safety program instead of evaluating each activity in isolation.
Different SSC capabilities answer different questions. Together, they give leaders a more useful picture of how the organization is operating and where improvement opportunities may be emerging.
Current visibility
See work that still needs attention so important follow-up is less likely to disappear into disconnected records.
Trend visibility
Review how activity changes over time so a single event or short-term fluctuation does not become the entire story.
Participation visibility
Include employee involvement and other leading activity in the conversation instead of relying only on lagging outcomes.
Decision support
Use connected information to help determine where leadership attention, resources, coaching, or process improvement may be needed.
Keep actionable work visible.
The Activity Dashboard gives Safety Managers a current view of items that may require attention. It helps shift the daily question from "What did I forget to check?" toward "What needs my attention now?"
Use operational data to identify areas worth exploring.
The Reporting Dashboard helps organizations move from individual transactions toward broader understanding. Visual summaries and trends can reveal patterns that deserve additional investigation or discussion.
Follow changes in employee survey results over time.
SSC's Safety Temperature Trend provides a historical view of the organization's Safety Temperature using daily snapshots and a rolling calculation, making it easier to see movement over time rather than relying on one survey result alone.
Take useful reporting into leadership meetings and follow-up conversations.
Downloadable charts, PDFs, Excel reports, and other exports are available across supported SSC workflows so information can be reviewed outside the application when a meeting, audit, presentation, or deeper analysis requires it.
Do not wait for an injury rate to tell you whether the safety program is working.
Lagging outcomes remain important, but they describe what has already happened. Participation, observations, inspections, training activity, surveys, and other leading information can provide earlier visibility into how the safety program is functioning and where leadership may want to look more closely.
Use trends to understand whether improvement efforts are changing the organization.
A snapshot shows where things stand today. Trend reporting adds context by showing where the organization has been and how activity is changing. That makes it easier to recognize progress, identify recurring challenges, and establish the next improvement priority with better information.
Great reporting reduces uncertainty instead of creating more noise.
The objective is not to overwhelm leaders with more charts. It is to make meaningful information easier to see so conversations become more specific, priorities become clearer, and Safety Managers can spend less time assembling data and more time helping the organization act on it.